A year ago, at NAB New York 2022, I shared the beta of our new DTS AutoStage Broadcaster Portal, guessing that it might just resonate with the industry. It was the outline of an incredible data-driven story for the broadcast industry — a story of understanding in-vehicle listener behavior and engagement that had never been told before. But, we had yet to fill in plot, characters or even setting.
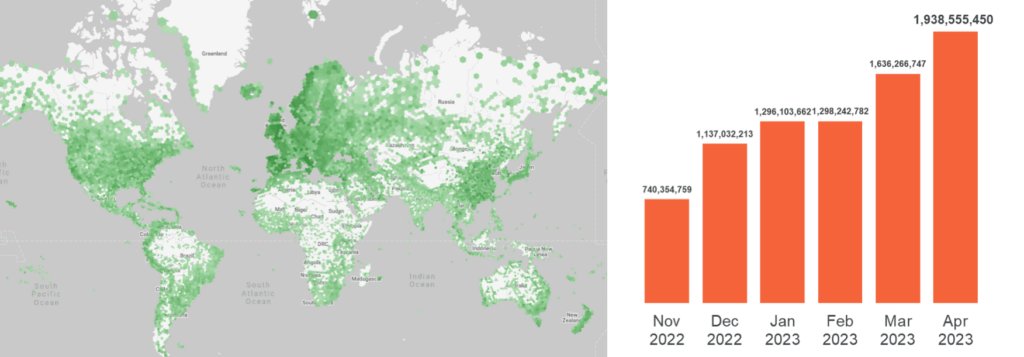
One year later, as we prepare for 2023 NAB Show NY, our story has been written around the world thousands of times a day, has millions of contributors and, we believe, is vital to the future of radio. It has a setting that spans 144 countries, a thrilling cast of characters with over 4 million vehicles, 100+ models and over 8 billion listener engagements, and a plot that ‘thickens’ every day through over 90,000 radio stations across the globe.
First, the prologue
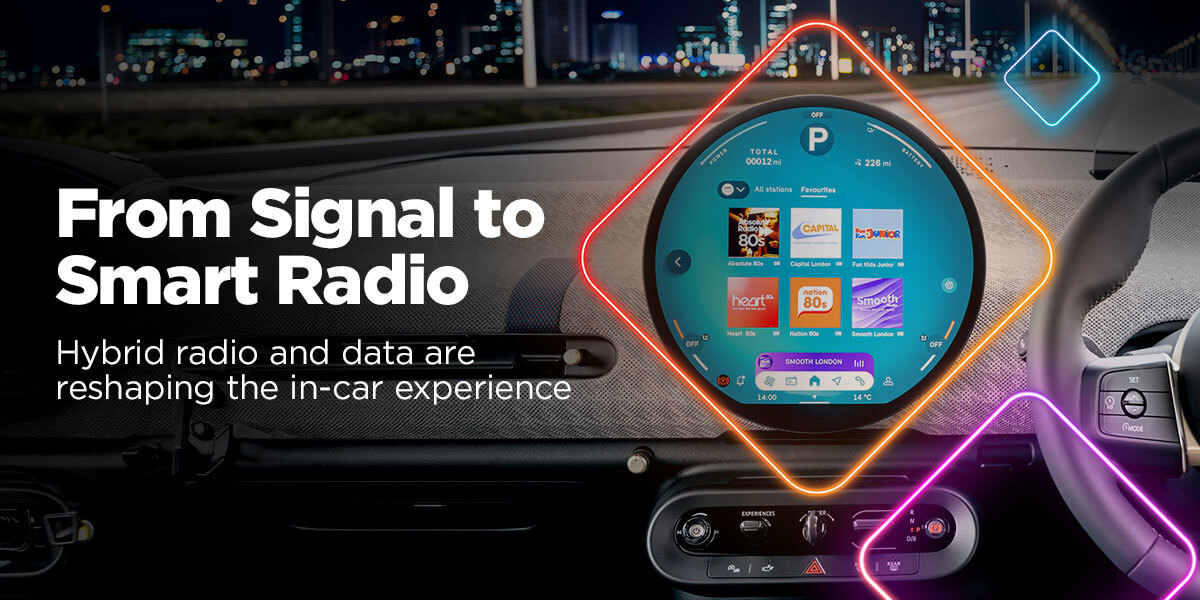
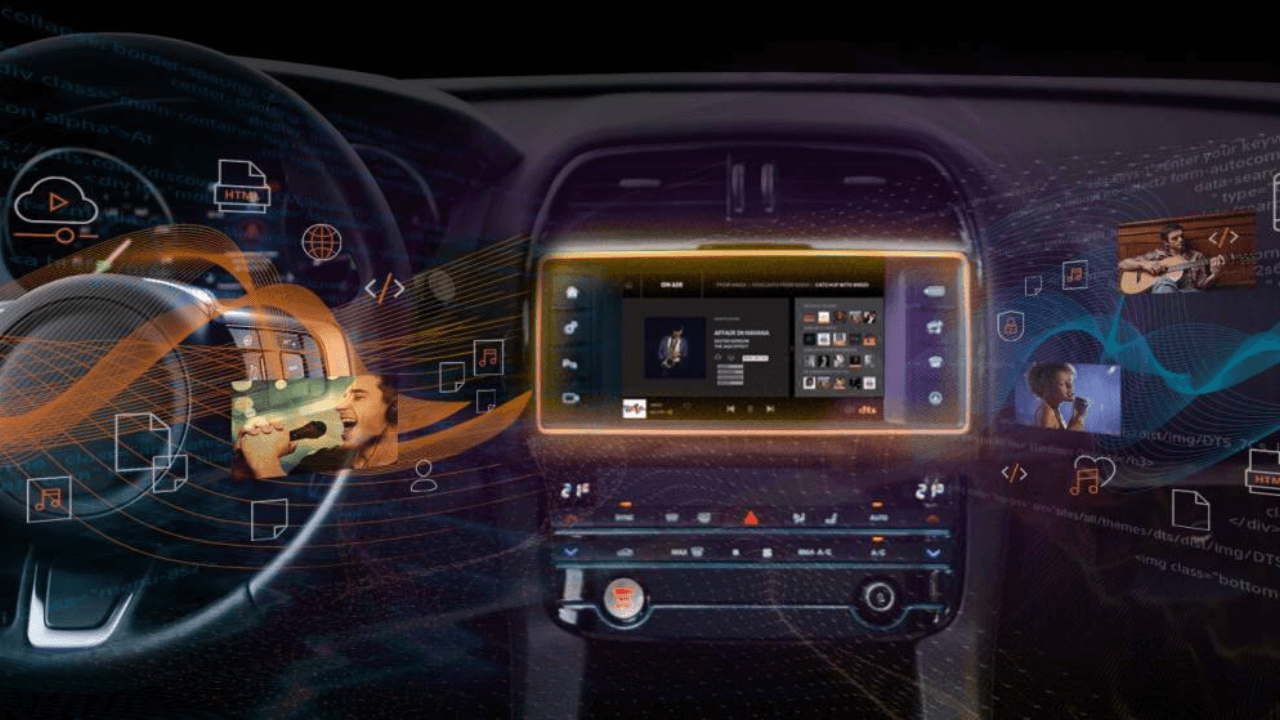
DTS AutoStage is an in-vehicle media platform, centered around radio, that delivers a visually rich, safe and immersive entertainment experience in the connected car. It enables radio stations to offer consumers a much richer narrative and, in turn, through its broadcaster portal, offers broadcasters metrics and insights that can deepen that story.
In our industry, while there are excellent and indispensable ways to measure how radio stations and programming are performing, until now, there has never been a way to gain timely insights to specifically target listeners when they are in their vehicles. And this is important, because as our world becomes increasingly digitized and mobile, and vehicles more connected, understanding what, when and how consumers make content choices when they are in their cars is critical to helping programmers develop and deploy content choices and advertisers make smart, efficient, effective, and geographically targeted choices.
So what stories can the DTS AutoStage Broadcaster portal tell?
Like any good story, it will tell you ‘who, what, when, where and how,’ i.e. who your in-vehicle listening audience is in your markets; what programming is attracting the largest audience; when your audience is tuning in and tuning out throughout the day; where your audience is concentrated and listening in your market and how your audience is tuning into your station — analog, DAB, HD Radio, etc.
And that story is very important to OEMs and broadcasters alike because not only can it help with operational excellence and consistency, but it also facilitates informed programming decisions as it deepens understanding of audience engagement and behaviors, all of which enable the creation of a framework for infrastructure planning and optimization. And, because the portal gives broadcasters complete control over station information, quality and consistency are ensured, and market performance, station reach and audience are understood, and available, throughout the day, including where and when those audiences are listening as they travel.
A Jersey Shore story
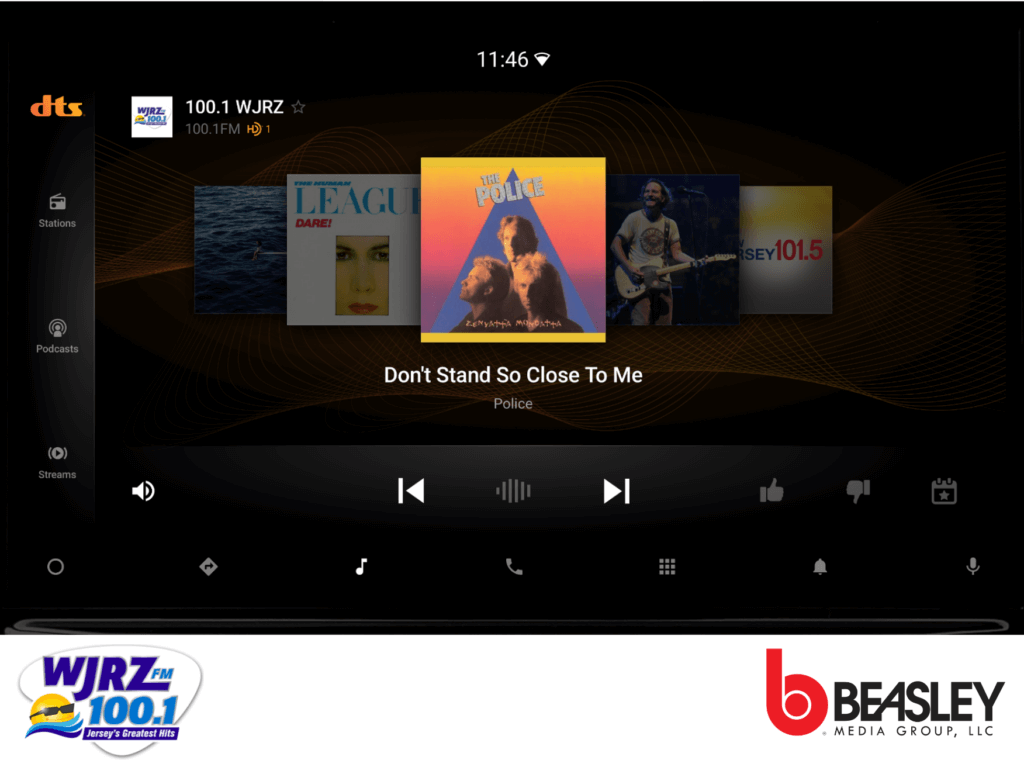
I recently shared the stage at WorldDAB with Caroline Beasley of Beasley Media, which has 61 stations in 14 markets and is the fifth-largest broadcaster in America. She shared why she feels it is important to have a platform that understands your content and enables you to control the narrative. “We want to provide a great listening experience for our audience and the DTS AutoStage platform really helps. For example, I can look at the station logos and be sure they are branded properly, and that the metadata is correct. I can look at an increase or decrease in listening and if there is a decrease, I can dig into that even further. Previously, we haven’t been able to get access to this data nearly this quickly: a 24-hour turnaround is critical to helping us with content,” said Caroline.
Here is a story Caroline shared from station WJRZ as illustrated in this chart which shows audience flow through the day for May 29:
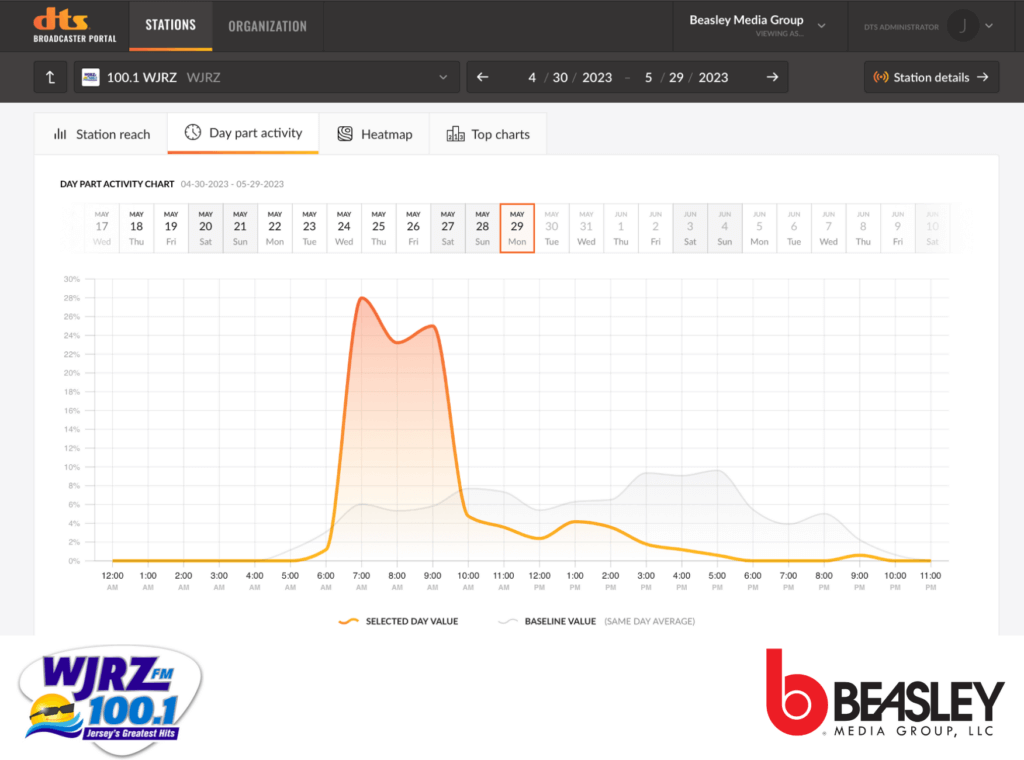
May 29 was a holiday, Memorial Day weekend, and WJRZ is a classic rock station located near the Jersey Shore. You can see a huge listening bump in the early hours as people listened to the radio as they drove to the shore and then, as they got stuck in awful holiday beach traffic, continued listening to the radio…and then you can see how it dropped off once they were there.
But the plot thickens, you can go even deeper into the story that is being told about WJRZ with the portal’s heat map:
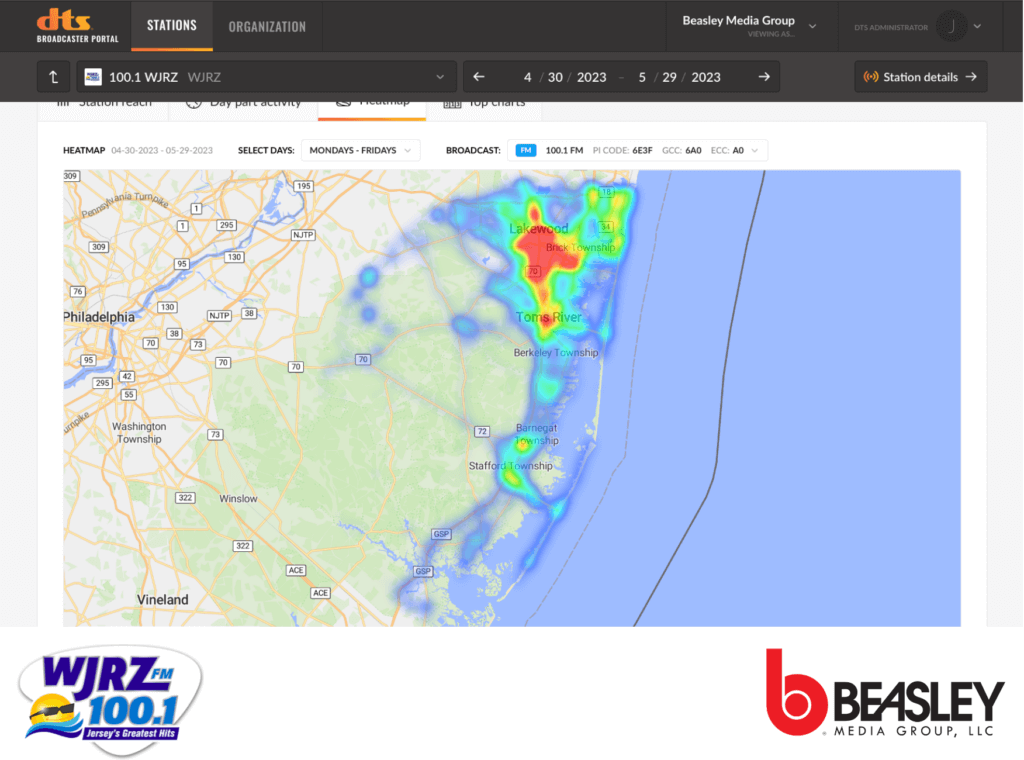
This shows precisely where those listeners were as they listened. When you overlay broadcast signal coverage over the heat map, you have an unparalleled view of your audience.
“This is really helpful,” said Caroline. “Because it shows us where our audience is primarily located, so if we want to target promotions or our audience for an event, we know the zip codes that we can target. In addition, as we are going out and selling to local advertisers, we can show them how we can precisely connect them to an audience that is helpful to them.”
And, because the portal measures data consumption, and broadcasters are sending live data directly to the portal about what they are playing, we are able to measure individual audio events.
Musical stories
We can tell stations exactly how many in-vehicle listeners are listening to a song or an ad at any given time (and where). We can tell, for example, what the most listened-to songs by in-vehicle listeners are on any station, which is an incredible tool for program directors.
Underscoring that data story, earlier this year we published a Top Most Listened to Music Genre In-Vehicle list based on data from the portal. The music stories the data tells are incredibly robust, offering insights from the most obvious, i.e., which genre lists Taylor Swift is topping (hint: all of them) to being able to predict a potential rising, yet mostly unknown, music star based on how fast that artist gains in ranking among in-vehicle listeners. And, with access to this kind of data, program directors can put a new song in rotation and see how it performs, whether it is under or over what they expect, and evolve content from there.
“We are very excited about this because it is going to help our music directors, but also will help with ads. If we are playing an ad for an advertiser and there is tune out we need to know. It is going to be a win-win all around. We are very excited about this technology,” concluded Caroline.
The next chapters
So, this is just the first chapter of a long and exciting story. Moving forward, we believe the portal is going to unlock amazing potential for all our broadcaster and OEM partners (we have already launched with five OEMs with four more in the next couple of months and 13 projected by this time next year).
We came to the industry five years ago and said we think we can deliver this: insights that characterize your audiences in your market and it can be done globally to create an extremely valuable tool for broadcasters, but only if you trust us as your integration partner. And trust us you did. Thank you.
So, perhaps I forgot the most important part of this story — how much it costs. Well, it doesn’t. Platform participation is free to broadcasters, these deep analytics come at no charge. The data is yours to do with what you want, so you can start to write the story of YOUR station in the connected car, every single day.
Stay up to date on the latest technology and insights from DTS here.